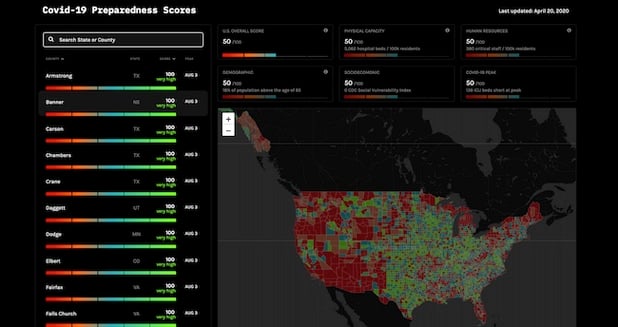
- As COVID-19 takes its toll on rural America, we are reminded how important it is to have access to good data and visualization tools. The Center on Rural Innovation's (CORI) mapping and data analytics team recently partnered with STAT and New Lab to create a county preparedness score that looks at how well counties are equipped to respond to COVID-19. Rather than focusing on just densely populated urban and suburban areas, CORI made sure there was available information for every county across the country, regardless of size or population.
Why aren't there more maps and data visualization tools that focus on rural America? What makes rural data somewhat more challenging to interpret?
In this webinar, we're joined by Chris Rowe, Geospatial Products Manager at CORI. We discuss some challenges of working with rural data and why now more than ever, it's important to use mapping and data visualization tools to share information on rural communities.
During the demo, Chris walks through the different data sets that were used to create the COVID-19 dashboard. He call out the varying degree of preparedness across the country and explain how the preparedness scores are based of five important variables.
-
What you’ll learn…
- Why data visualization is so important in rural areas - especially in the time of a pandemic
- How CORI used CARTO to create a COVID-19 preparedness tracker
- How to source & make effective use of the huge amount of COVID-19 related data sets available-
A pdf of the slides of the presentation is also available to download here.

.jpeg)