
Lucía García-Duarte
Data Scientist at CARTO

Mark Gibbas
CEO at Weather Source
Data Scientist at CARTO
CEO at Weather Source
Last year, more than 8,000 wildfires burned almost 2.6 million acres in the state of California alone. In fact, recent studies have shown a dramatic increase in global wildfire activity as a result of increasing temperatures, drought and fuel aridity among others, leading to warmer springs, longer summer dry seasons and drier vegetation.
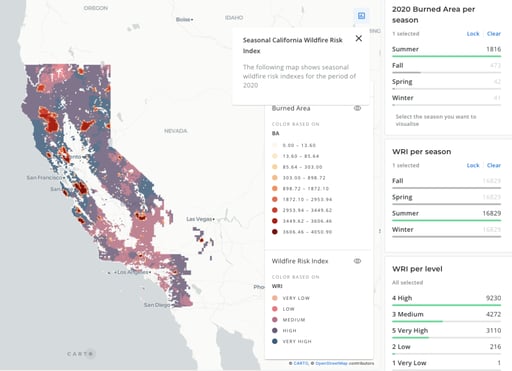
As climate change continues to increase the likelihood of natural disasters, decision makers are turning to alternative datasets to better understand and prepare for wildfire season. In this webinar, we outline how to build a Wildfire Risk Index using weather data and spatial analysis to more accurately predict wildfire risks in the future.
Our speakers, Lucía García-Duarte (Data Scientist at CARTO) and Mark Gibbas (CEO at Weather Source), walk us through:
- What is weather data and why so many analytics professionals are using it
A PDF of the slides of the presentation is also available to download here.